ISO Fun

I’m not a compulsive upgrader, most of the time the latest release of something is barely any better (and too often a step backwards when the marketing people take over and just change things for the sake of change instead of allowing engineering to improve the product.. but that’s another topic). I tend to wait until upgrading is absolutely worth it.

On the photography front, I’ve been using my old Nikon D40 for the longest time. While it was the low end DSLR from Nikon at the time, it was quite good (perhaps better than Nikon intended, since a few of the following-generation DSLR were arguably a step backwards!)

Smaller nitpicks aside, my main wish for improvement has been high-ISO performance. But I used to take mostly scenic/nature pictures where it didn’t really matter that much (I could always use the tripod and a longer exposure, the mountains weren’t moving). Now with a fast moving toddler in the house it has become more limiting. I now need to use faster shutter speeds but the D40 just wasn’t cutting it when light was poor.

So I’ve now upgraded to a D7100. The high-ISO performance is very impressive!

The two pictures below were taken from the same place with the same light (ceiling lights at night in the living room) with the same lens (Nikon 35mm f/1.8), same settings (1/125s, f/1.8).

Here’s the D40 picture (ISO 800):

DSC_5674And here’s the D7100 comparison (ISO 4000):

DSC_0125And the D7100 goes up to ISO 6400 without much degradation so it would’ve worked in even slightly less light!

There’s a lot of other little niceties in the D7100 over the D40, but I could live without any of those. But this high-ISO performance is an awesome and badly needed upgrade!


Americas Cup: Weakest show in the world

I love sailing, so I’ve been trying to watch the Americas Cup in San Francisco but it is just too painfully weak to bother. Day after day, races get canceled due to wind! Wind! The breeze is under 20 knots and they are too afraid to sail. Do none of them understand sailing is about wind? What a sad joke is the Americas Cup.

Bring on the Big Boat Series, for real San Francisco sailboat racing. Let the pathetic Americas Cup be forgotten.

The Curse of Maven

This is my most delayed blog entry ever… I wrote the first draft many years ago and for some reason it just sat there. Recently a friend got stuck having to deal with maven and I remembered this article, so might as well post it.

Lately we’re seeing lots of tools which completely miss the point of The UNIX Philosophy. Perfection is achieved through a collection of small simple tools, all of which do one thing very well and allow themselves to be combined with ease.

A counterexample which gets everything wrong is maven. It’d be easy to dismiss tools which are as bad as that. Unfortunately the attraction of these tools is that they make it very easy to get started and thus they become hugely popular (another example of this thinking is Rails; yet another example is Hibernate).

The siren call of these tools is they let you get started without effort nor understanding, which is not a bad thing in itself. But as soon as your project grows beyond the hello world stage, you’ll be stuck wasting most of your time fighting the constraints of the tool. It is never a bargain worth making.

Here’s the example that motivated this article some years ago. This is an actual piece from a maven build file I had to work on once:

      <plugin>
        <groupId>org.codehaus.mojo</groupId>
        <artifactId>exec-maven-plugin</artifactId>
        <version>1.1.1</version>
        <executions>
          <execution>
            <id>some-execution</id>
            <phase>package</phase>
            <goals>
              <goal>exec</goal>
            </goals>
          </execution>
        </executions>
        <configuration>
          <executable>tar</executable>
          <workingDirectory>${project.build.directory}</workingDirectory>
          <arguments>
            <argument>-zxvf</argument>
            <argument>${project.name}-${project.version}-distribution.tar.gz</argument>
          </arguments>
        </configuration>
      </plugin

Here is the equivalent line (yes, one line!) from a Makefile:

        cd ${project.build.directory} && tar -zxf ${project.name}-${project.version}-distribution.tar.gz

The specific action here is not the point (I bet there is a maven plugin these days to make builing a tarball a bit easier, though not as easy as with the Makefile; keep in mind this example is from years ago). The fundamental insight here is that a tool like maven which requires every action to be built will by definition never be able to be as flexible and effective as a tool which can directly leverage all the existing tooling available on UNIX.

More recently I’ve been having to deal with gradle instead. While it is a slight improvement over maven, it is also a result of this misguided culture of trying to hide complexity which results in making easy things easy, moderate things excruciatingly difficult and difficult things completely impossible.

Here’s another article on the topic: Why Everyone (Eventually) Hates (or Leaves) Maven


Satisfying debian JDK package dependencies

I prefer to run the Sun JDK on my debian servers but this presents a bit of a logistical inconvenience. Because debian now packages OpenJDK instead, all the other Java packages depend on it. What I’d really prefer to do is manually install the (non-packaged) Sun JDK and tell dpkg that the JDK dependency is satisfied so I can still install any java tools directly via apt.

(There is a java-package in debian which is meant to address this by converting the JDK download into an installable package, but unfortunately it appears to always be sufficiently behind in its JDK version support that it has never worked for me.)

Luckily there is an easy way out. I didn’t find an explicit how-to on doing it so writing down these notes for my (and perhaps your) future benefit.

Install the equivs package:

# apt-get install equivs

Create a template for a ‘jdk’ package:

# equivs-control jdk

Edit that template so it provides the necessary content. Adjust this to specific needs on a given system but this is what I’m using currently (if you use this as-is there’s no need to create the template above, but it is useful to see what fields it provides, perhaps they change over time):

Section: misc
Priority: optional
Standards-Version: 3.9.2
Package: manual-jdk
Version: 1.7
Depends: java-common
Maintainer: <root@localhost>
Provides: java6-runtime-headless, java-compiler, java-virtual-machine, java2-runtime, java2-compiler, java1-runtime, default-jre-headless, openjdk-7-jre-headless, openjdk-7-jre-lib
Description: Manually installed JDK
 JDK was installed manually. This package fulfills dependencies.

Then, build the placeholder package:

# equivs-build jdk

This will produce a .deb package named after the info in the above template, ready to be installed.


TLS and RC4 (March 2013)

You have probably read (e.g. at slashdot and everywhere else) about this month’s SSL/TLS weakness, this time around related to RC4.

The authors have a good page at http://www.isg.rhul.ac.uk/tls/ which is a good starting point. The slide deck at http://cr.yp.to/talks/2013.03.12/slides.pdf has nice raw data and graphs.

The attack

RC4 is a stream cipher (not a block cipher like DES or AES). In short, RC4 is essentially a pseudo-random number generator. To encrypt, the resulting stream of bits are combined (XOR’d) with the plaintext to generate the ciphertext. Ideally, if the random bits were truly random there would not be any patterns or biases in the output. For every byte, each possible value (0-255) should be equally likely.

This is not quite true for RC4. Also, that is not news, it had been shown earlier. But this latest work has mapped out in detail the biases in all first 256 bytes of the stream output (the slide deck has graphs for all of those). Given that info, it becomes statistically possible to recover plaintext from the first 256 bytes. The probability of success depends on how much ciphertext has been captured. See slides 305 to 313 of the slide deck for success probabilities. To summarize, with 224 ciphertexts we can already recover some bytes. With 232 ciphertexts we can recover just about all of the plaintext with near certainty.

This attack is on RC4 output, not specific to TLS protocol. TLS is the victim since RC4 is used in several of the most commonly used TLS ciphersuites. Recall that as a mitigation to some of the other recent TLS attacks there have been recommendation to switch to RC4 as a way to avoid the CBC ciphersuites! Now the pendulum swings the other way.

In practice

As with most attacks, the theoretical result is not necessarily so easily applied in practice.

This attack has a few things going for it though. It is not a timing attack, so it does not need to rely on carefully measuring execution time biases over a noisy network. Also, the attacker only needs to passively observe (and record) the encrypted exchanges between the two parties. The attacker does not need to be able to intercept or modify the communication.

The attacker still does need to capture a fair amount of ciphertext. On the surface, the numbers are not very big. 224 is less than 17 million requests (although that only gets you some bytes of the plaintext). For certainty, 232 is over 4 billion requests. Harder, but not an intractable problem. And as the saying goes, attacks only ever get better. It is conceivable some future work will identify even more efficient ways of correlating the content.

For the attack to work, each of those requests does need to have the same plaintext content in the same location (or, at least, for those bytes we care to recover). Assuming HTTP plaintext, the protocol format will tend to produce mostly constant content which works to the benefit of the attacker.

For example, take the following request (edited, but a real capture from my gmail connection). The cookie value starts at about byte 60 and if the browser generated it in that location once, every repeat of the same request is likely to have the same content in the same place.

GET /mail/?tab=om HTTP/1.1
Host: mail.google.com
Cookie: GX=ahc8aihe3aemahleo5zod8vooxeehahjaedufaeyohk4saif8cachoeph...
...

So now the attacker just needs to trick the victim’s browser into repeating those requests and sit back and record the traffic. Tricking the browser into making the requests is not that hard, plenty of attack channels available on that front. Successfully making enough of them before someone/something notices (e.g. gmail monitoring… although your local credit union probably won’t notice as fast) or the content changes (e.g. cookie expires) will be trickier but not impossible.

So it seems to me this attack is relatively hard to pull off in practice right now, but not impossible. Repeat the attack enough time on enough people and a few will succeed.

Some prevention

  • Change cookie/token values (whatever content is valuable to attack) often enough that capturing enough ciphertext within that time window becomes that much harder or even impossible.
  • Making header order/length unpredictable would help (same bytes won’t be in the same locations) but needs to be done by browsers (for the most likely attack scenario).
  • Avoid RC4 ciphersuites.
  • AES-GCM ciphersuites have been mentioned as an alternative to avoid both RC4 and CBC modes, but support for those is not quite there yet and there is a performance penalty.

Additional reading…


Using node.js for serving static files

A couple months ago I ran some tests on web server static file performance comparing a handful of web servers. I’ve been curious to add node.js into the mix just to see how it behaves. Last night I ran the same test suite against it, here are the results.

There are a handful of caveats:

  1. Serving files isn’t a primary use case for node.js. But I’ve seen it being done so it’s not unheard-of either.
  2. By itself node.js doesn’t handle serving static files so to test it I had to pick some code to do so. There isn’t any one standard way so I had to pick one. After extensive research (about 15 minutes of googling) I went with ‘send‘. I’m using the sample from the readme as-is. There is some risk that I picked the worst choice and a different node.js solution for static files might be much better! If so, please let me know which one so I can try it.

I used node 0.8.18 (latest as of today) and send 0.1.0 as installed by npm.

For details on the benchmark environment see my earlier article and previous results. I ran exactly the same test on the same hardware and network against node.js as I did earlier with the other web servers.

All right, so how did it do? Very, very slowly, I have to say.

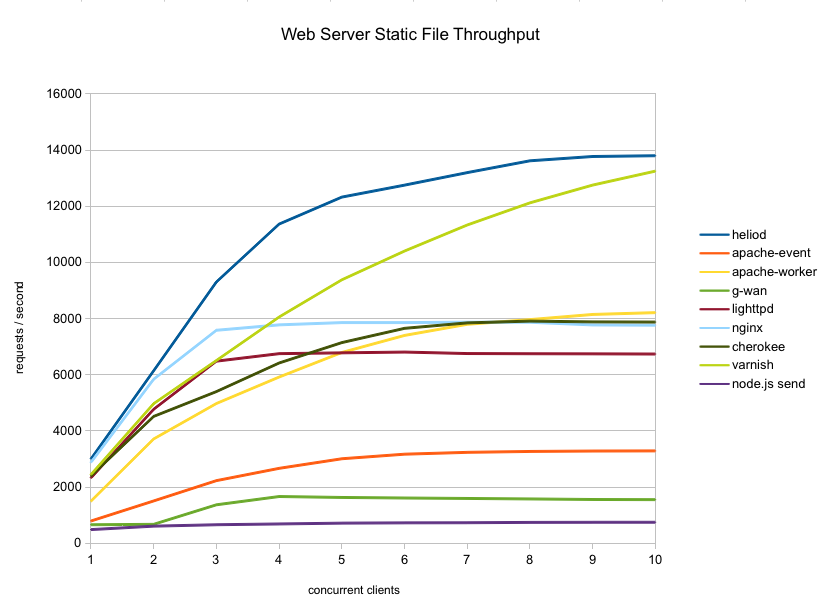
Average throughput (over the 30 minute test run) was only 490 req/s with a single client (sequential requests) which is slower than anything else I’ve seen before. Node.js inches up to 752 req/s with ten concurrent clients (remember these are zero think-time clients). Here is the throughput graph including all the previously tested server with the addition of node.js:

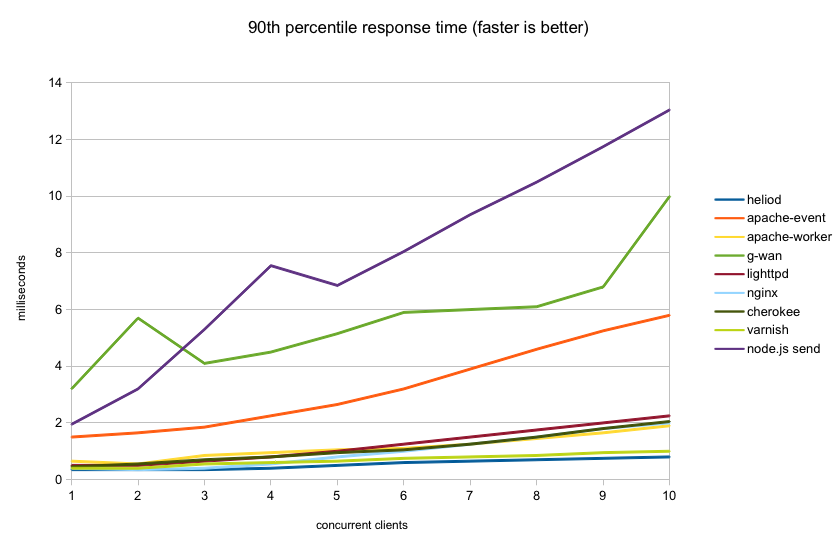
How about response times? The graph below shows the 90th percentile response time from the run. With only one or two concurrent clients, node.js has slightly better response time than g-wan but still slower than everything else. As concurrent clients increase, node.js becomes slower than any other choice. This is not surprising given its single-threaded cooperative multitasking design.

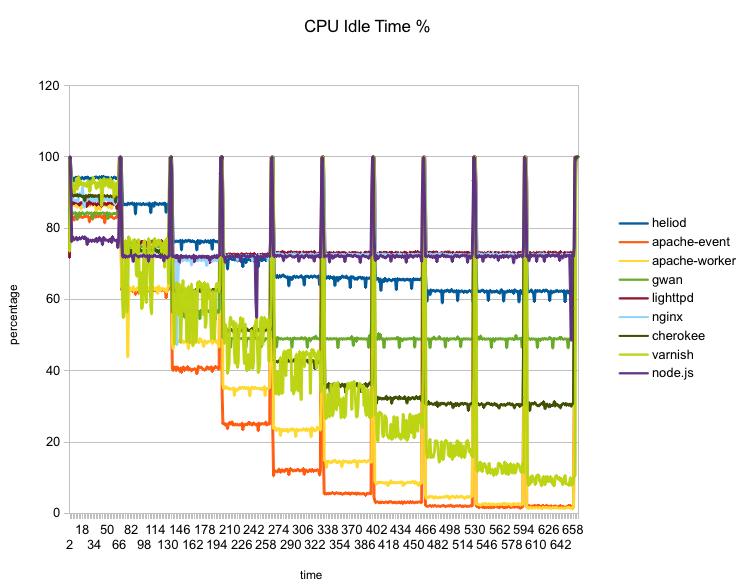
No surprises in the CPU utilization graph. Given that node.js is single-threaded, it can only take advantage of one hardware thread in one core so it maxes out at roughly 75% idle.

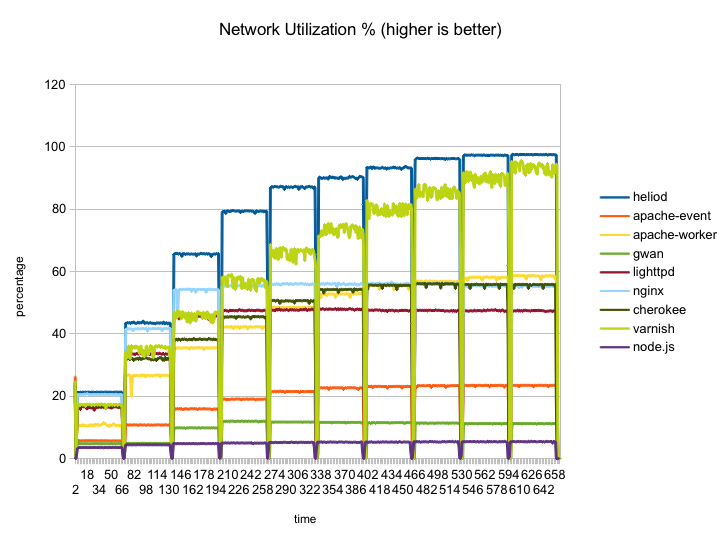
Network utilization is particularly bad, peaking at a max of about 5.5% of the gigabit interface. Every other web server can pump out a lot more data into the pipe.

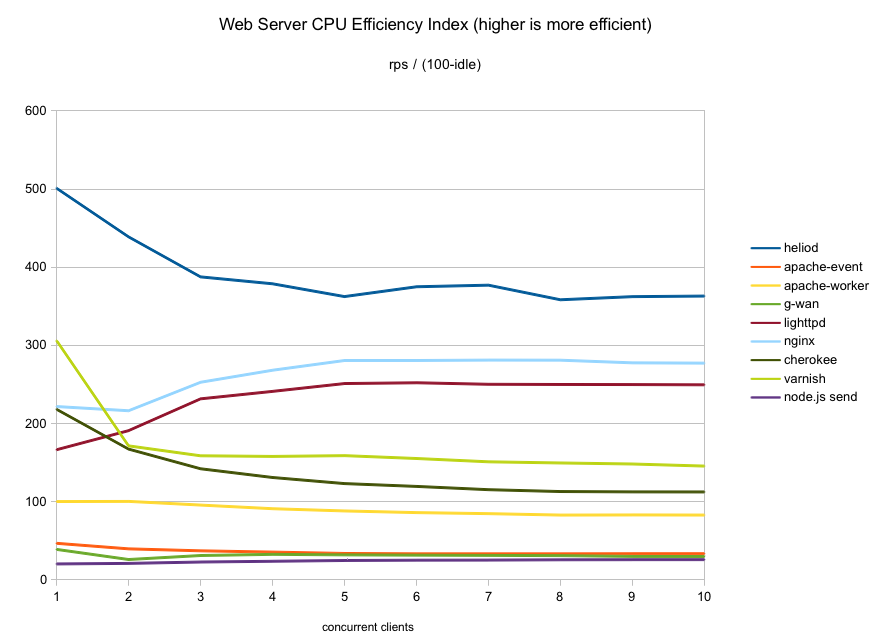
Given the above results, needless to say node.js will not score well in my ‘web server efficiency index’ (see my post on web server efficiency). For static files, node.js is the least efficient (least bang for the CPU buck) solution. Here’s the graph:

In summary… if you’re thinking about serving static files via node.js, consider an alternative. Any alternative will be better! In particular, if you want to maximize both performance and efficiency, try out heliod. If you prefer going with something you may be more familiar with, nginx will serve you well. Or as a front-end cache, varnish is also a solid choice (although not as efficient).


Duplicate file detection with dupd

I love my zfs file server… but as always with such things, storage brings an accumulation of duplicates. During a cleaning binge earlier this year I wrote a little tool to identify these duplicates conveniently. For months now I’d been meaning to clean up the code a bit and throw together some documentation so I could publish it. Well, finally got around to it and dupd is now up on github.

Before writing dupd I tried a few similar tools that I found on a quick search but they either crashed or were unspeakably slow on my server (which has close to 1TB of data).

Later I found some better tools like fdupes but by then I’d mostly completed dupd so decided to finish it. Always more fun to use one’s own tools!

I’m always interested in performance so can’t resist the opportunity to do some speed comparisons. I also tested fastdup.

Nice to see that dupd is the fastest of the three on these (fairly small) data sets (I did not benchmark my full file server because even with dupd it takes nearly six hours for a single run).

There is no result for fastdup on the Debian /usr scan because it hangs and does not produce a result (unfortunately fastdup is not very robust and looks like it hangs on symlinks… so while it is fast when it works, it is not practical for real use yet).

The times displayed on the graph were computed as follows: I ran the command once to warm up the cache and then ran it ten times in a row. I discarded the two fastest and two slowest runs and averaged the remaining six runs.


Web Server Efficiency

In my previous article I covered the benchmark results from static file testing of various web servers. One interesting observation was how much difference there was in CPU consumption even between servers delivering roughly comparable results. For example, nginx, apache-worker and cherokee delivered similar throughput with 10 concurrent clients but apache-worker just about saturated the CPU while doing so, unlike the other two.

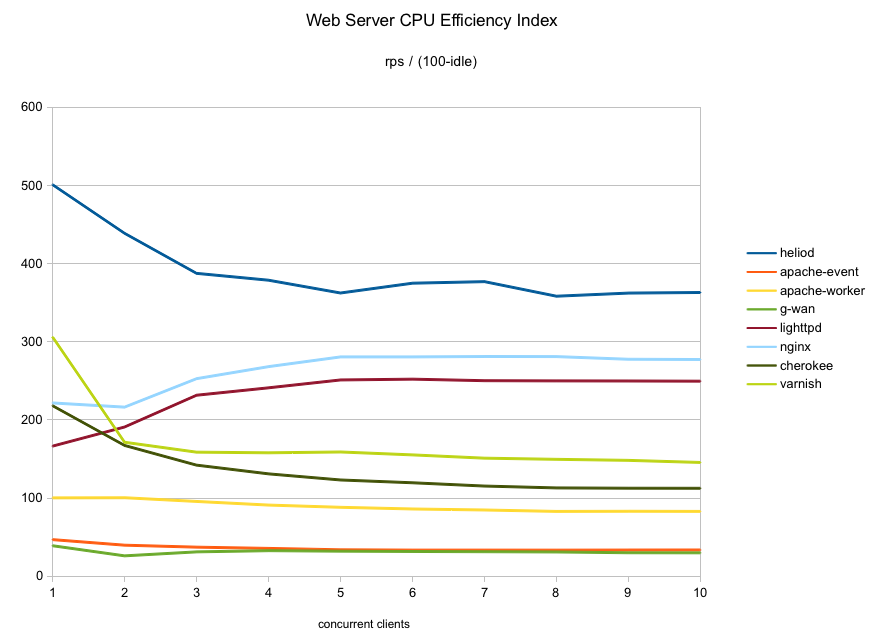
I figured it would be interesting to look at the efficiency of each of these servers by computing throughput per percentage of CPU capacity consumed. Here is the resulting graph:

In terms of raw throughput apache-worker came in third place but here it does not do well at all because, as mentioned, it maxed out the CPU to deliver its numbers. Cherokee, previously fourth, also drops down in ranking when considering efficiency since it also used a fair amount of CPU.

The largest surprise here is varnish which performed very well (second place) in raw throughput. While it was almost able to match heliod, it did consume quite a bit more CPU capacity to do so which results in relatively low efficiency numbers seen here.

Lighttpd and nginx do well here in terms of efficiency – while their absolute throughput wasn’t as high, they also did not consume much CPU. (Keep in mind these baseline runs were done with a default configuration, so nginx was only running one worker process.)

I’m pleasantly surprised that heliod came on top once again. Not only did it sustain the highest throughput, turns out it also did it more efficiently than any of the other web servers! Nice!

Now, does this CPU efficiency index really matter at all in real usage? Depends…

If you have dedicated web server hardware then not so much. If all the CPU is doing is running the web server then might as well fully utilize it for that. Although there should still be some benefit from a more efficient server in terms of lower power consumption and lower heat output.

However, if you’re running on virtual instances (whether your own or on a cloud provider) where the physical CPUs are shared then there are clear benefits to efficiency. Either to reduce CPU consumption charges or just to free up more CPU cycles to the other instances running on the same hardware.

Or… you could just use heliod in which case you don’t need to choose between throughput vs. efficiency given that heliod produced both the highest throughput (in this benchmark scenario anyway) and the highest efficiency ranking.


The fastest web server is …

A few days ago I mentioned that I had started doing some static file performance runs on a handful of web servers. Here are the results!

Please refer to the previous article on setup details for info on exactly what and how I’m testing this time. Benchmark results apply to the narrow use case being tested and this one is no different.

The results are ordered from slowest to fastest peak numbers produced by each server.

9. Monkey (0.9.3-1 debian package)

The monkey server was not able to complete the runs so it is not included in the graphs. At a concurrency of 1, it finished the 30 minute run with an average of only 133 requests/second, far slower than any of the others. With only two concurrent clients it started erroring out on some requests so I stopped testing it. Looks like this one is not ready for prime time yet.

8. G-WAN (3.3.28)

I had seen some of the performance claims around G-WAN so decided to try it, even though it is not open source. All the tests I’d seen of it had been done running on localhost so I was curious to see how it behaves under a slightly more realistic type of load. Turns out, not too well. Aside from monkey, it was the slowest of the group.

7. Apache HTTPD, Event MPM (2.2.16-6+squeeze8 debian package)

I was surprised to see the event MPM do so badly. To be fair, it should do better against a benchmark which has large numbers of mostly idle clients which is not what this particular benchmark tested. At most points in the test it was also the highest consumer of CPU.

6. lighttpd (1.4.28-2+squeeze1 debian package)

Here we get to the first of the serious players (for this test scenario). lighttpd starts out strong up to 3 concurrent clients. After that it stops scaling up so it loses some ground in the final results. Also, lighttpd is the lightest user of CPU of the
group.

5. nginx (0.7.67-3+squeeze2 debian package)

The nginx throughput curve is just about identical to lighttpd, just shifted slightly higher. The CPU consumption curve is also almost identical. These two are twins separated at birth. While nginx uses a tiny bit more CPU than lighttpd, it makes up for it with higher throughput.

4. cherokee (1.0.8-5+squeeze1 debian package)

Cherokee just barely edges out nginx at the higher concurrencies tested so it ends up fourth. To be fair, nginx was faster than cherokee at most of the lower concurrencies though. Note, however, that cherokee uses quite a bit more CPU to deliver its numbers so it is not as efficient as nginx.

3. Apache HTTPD, Worker MPM (2.2.16-6+squeeze8 debian package)

Apache third, really? Yes but only because this ranking is based on the peak numbers of each server. With worker mpm, apache starts out quite a bit behind lighttpd/nginx/cherokee at lower client concurrencies. However, as those others start to stall as concurrency increases, apache keeps going higher. Around five concurrent clients it catches up to lighttpd and around eight clients it catches up to nginx and cherokee. At ten
it scores a throughput just slightly above those two, securing third place in this test. Looking at CPU usage tough, at that point it has just about maxed out the CPU (about 1% idle) making it the highest CPU consumer of this group so it is not very efficient.

2. varnish (2.1.3-8 debian package)

Varnish is not really a web server, of course, so in that sense it is out of place in this test. But it can serve (cached) static files and has been included in other similar performance tests so I decided to include it here.

Varnish throughput starts out quite a bit slower than nginx, right on par with lighttpd and cherokee and lower concurrencies. However, varnish scales up beautifully. Unlike all the previous servers, its throughput curve does not flatten out as concurrency increases in this
test, it keeps going higher. Around four concurrent users it surpasses nginx and only keeps going higher all the way to ten.

Varnish was able to push network utilization to 90-94%. The only drawback is that delivering its performance does use up a lot of CPU… only Apache used more CPU than varnish in this test. At ten clients, there is only 9% idle CPU left.

1. heliod (0.2)

heliod had the highest throughput at every point tested in these runs. It is slightly faster than nginx at sequential requests (one client) and then pulls away.

heliod is also quite efficient in CPU consumption. Up to four concurrent clients it is the lightest user of CPU cycles even though it produced higher throughput than all the others. At higher concurrencies, it used slightly more CPU than nginx/lighttpd although it makes up for it with far higher throughput.

heliod was also the only server able to saturate the gigabit connection (at over 97% utilization). Given that there is 62% idle CPU left at that point, I suspect if I had more bandwidth heliod might be able to score even higher on this machine.

These results should not be much of a surprise… after all heliod is not new, it is the same code that has been setting benchmark records for over ten years (it just wasn’t open source back then). Fast then, still fast today.

If you are running one of these web servers and using varnish to accelerate it, you could  switch to heliod by itself and both simplify your setup and gain performance at the same time. Food for thought!


All right, let’s see some graphs..

First, here is the overall throughput graph for all the servers tested:
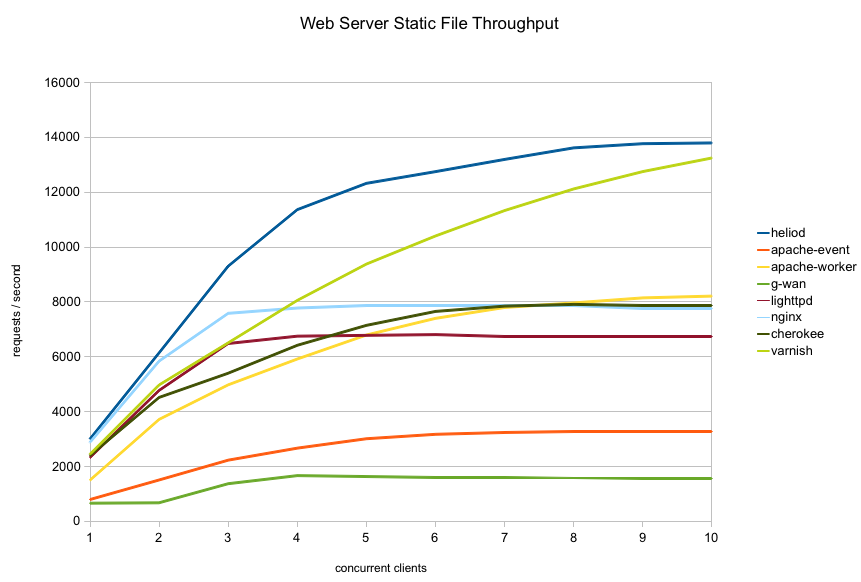
As you can see the servers fall into three groups in terms of throughput:

  1. apache-event and g-wan are not competitive in this crowd
  2. apache-worker/nginx/lighttpd/cherokee are quite similar in the middle
  3. varnish and heliod are in a class of their own at the high end

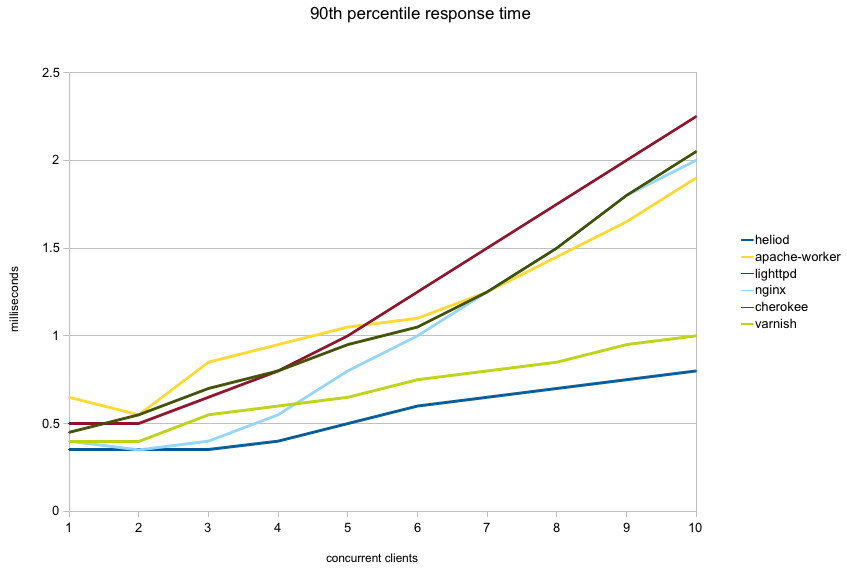
Next graph shows the 90th percentile response time for each server. That is, 90 percent of all requests completed in this time or less. I left out apache-event and g-wan from the graph to avoid compressing the more interesting part of the graph:
The next graph shows CPU idle time (percent) for each server through the run. The spikes to 100% between each step are due to the short idle interval between each run as faban starts the next run.

The two apache variants (red and orange) are the only ones who maxed out the CPU. Varnish (light green) also uses quite a bit of CPU and comes close (9% idle). On the other side, lighttpd (dark red) and nginx (light blue) put the least load on the CPU with about 72% idle.

Finally, the next graph shows network utilization percentage of the gigabit interface:
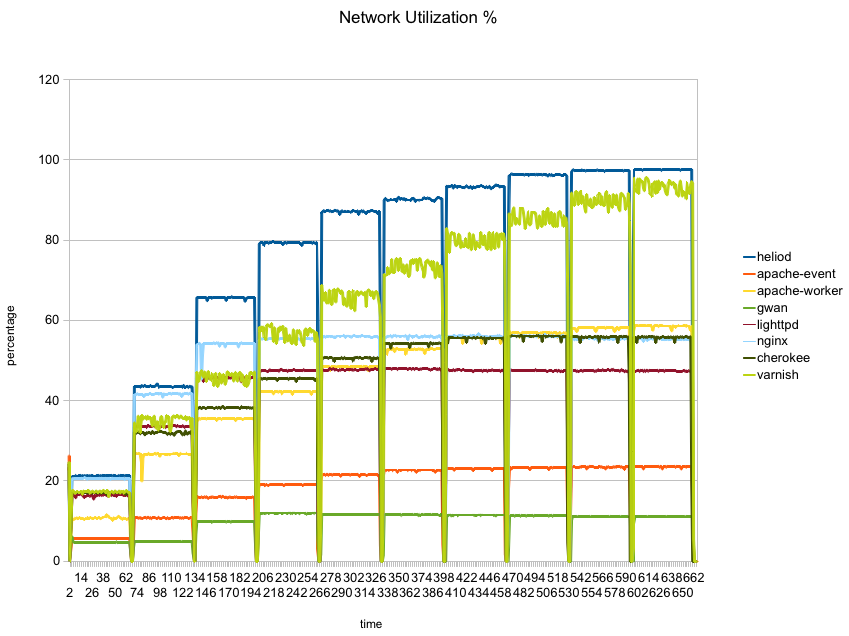
Here heliod (blue) is the only one which manages to saturate the network, with varnish coming in quite close. None of the others manage to reach even 60% utilization.

So there you have it… heliod can sustain far higher throughput than any of the popular web servers in this static file test and it can do so efficiently, saturating the network on a low power two core machine while leaving plenty of CPU idle. It even manages to sustain higher throughput than varnish which specializes in caching static content efficiently and is not a full featured web server.

Of course, all benchmarks are by necessity artificial. If any of the variables change the numbers will change and the rankings may change. These results are representative of the exact use case and setup I tested, not necessarily of any other. Again, for details on what and how I tested, see my previous article.

I hope to test other scenarios in the future. I’d love to also test on a faster CPU with lots of cores, unfortunately I don’t own such hardware so it is unlikely to happen.

Finally, I set up a github repository fabhttp which contains:

  1. source code of the faban driver used to run these tests
  2. dstat/nicstat data collected during the runs (used to generate the graphs above)
  3. additional graphs generated by faban for every individual run