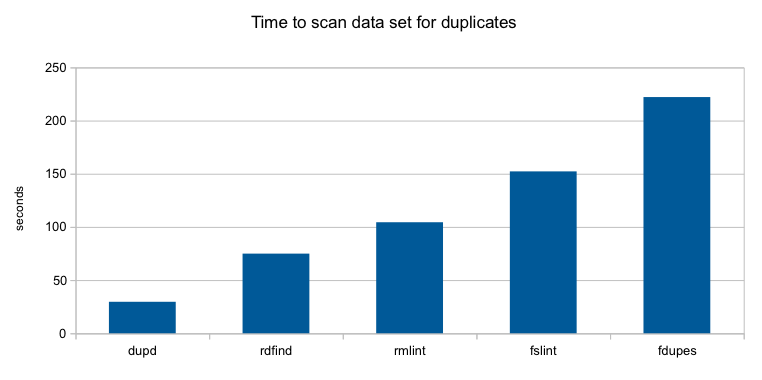
My previous comparison of dupd vs. jdupes prompted the author of jdupes to try it out on his system and write a similar comparison of dupd and jdupes from his perspective.
The TL;DR is you optimize what you measure. For the most part, jdupes is faster on Jody’s system/dataset and dupd is faster on mine. It’d be fun to do a deeper investigation on the details (and if I ever have some extra spare time I will) but for now I ran a few more rounds of tests to build on the two previous articles.
Methodology Notes
- First and foremost, while it is fun to try to get optimal run times, I don’t want to focus on scenarios which are so optimized for performance that they are not realistic use cases for me. Thus:
- SQLite overhead: Yes, dupd saves all the duplicate data into an sqlite database for future reference. This does add overhead and Jody’s article prompted me to try a few runs with the –nodb option (which causes dupd to skip creating the sqlite db and print to stdout instead, just like jdupes does). However, to me by far the most useful part of dupd is the interactive usage model it enables, which requires the sqlite database. So I won’t focus much on –nodb runs because I’d never run dupd that way and I want to focus on (my) real world usage.
- File caches: This time I ran tests both with warmed up file caches (by repeating runs) and purged file caches (by explicitly clearing them prior to every run). For me, the warm file cache scenario is actually the one most closely matching real world usage because I tend to run a dupd scan, then work interactively on some subset of data, then run dupd scan again, repeat until tired. For someone whose workflow is to run a cold scan once and not re-scan until much later, the cold cache numbers will be more applicable.
- I ran both dupd and jdupes with -q to eliminate informative output during the runs. It doesn’t make much difference in dupd but according to Jody this helps jdupes runtimes so I quieted both.
- By default, dupd ignores hidden files and jdupes includes them. To make comparable runs, either use –hidden for dupd to include them or –nohidden for jdupes to exclude them. I decided to run with dupd –hidden.
- The average time reported below from each set of runs is the average of all runs but excluding the slowest and fastest runs.
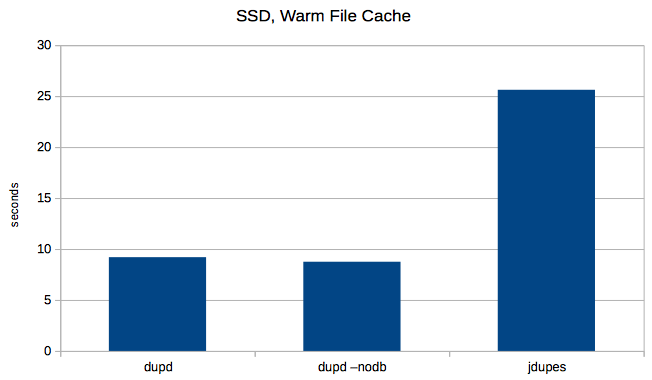
Results (SSD)
These runs are on a slow machine (Intel Atom S1260 2.00GHz) and SSD drive (Intel SSD 520) running Linux (debian) ext4.
Files scanned: 197,171
Total duplicates: 77,044
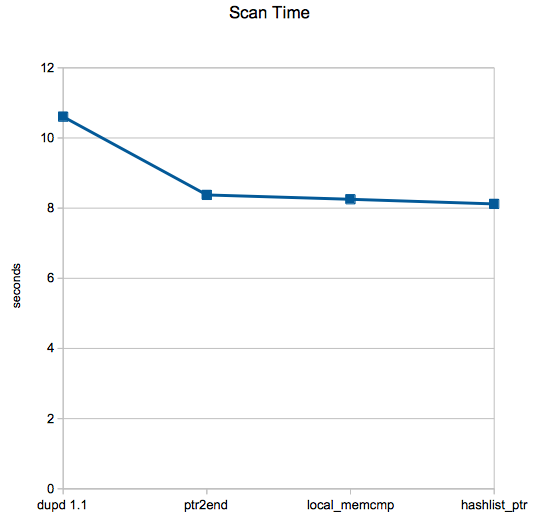
For my most common usage scenario, jdupes takes almost three times (~2.8x) longer to process the same file set. Running dupd with –nodb is marginally faster than dupd default run (but I wouldn’t really run it that way because the sqlite db is too convenient).
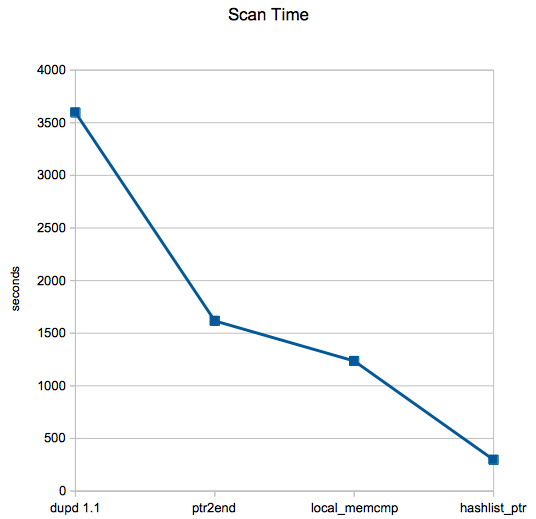
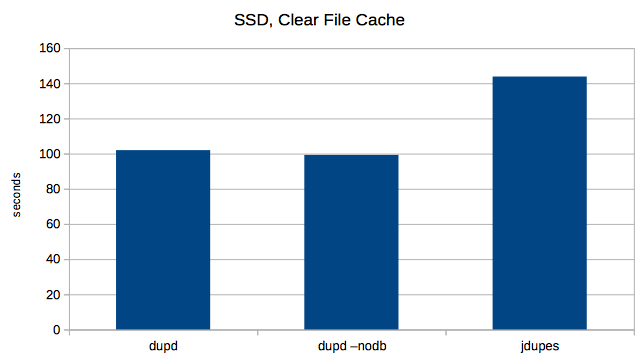
 Next I tried clearing the file cache before every run. Here the dupd advantage is reduced, but jdupes still took about 1.4x longer than dupd.
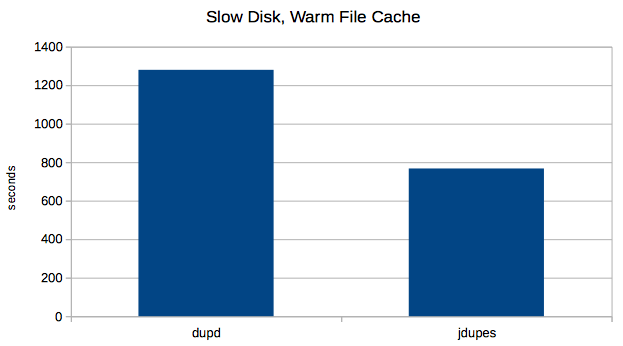
 Results (Slow Disk)
Jody’s tests show jdupes being faster in many scenarios, so I’d like to find a way to reproduce that. The answer is slow disks.. I have this old Mac Mini (2009) with an even slower disk which should do the trick. Let’s see. Fewer files, fewer duplicates, but the disk is so slow these runs take a while (so I only ran 5 repetitions instead of 7).
Files scanned: 62,347
Total duplicates: 13,982
Indeed, here jdupes has the advantage as dupd takes about 1.7x longer.
 A few notes on these Mac runs:
- I did also run dupd with –nodb, but here it didn’t make any meaningful difference.
- I also ran both dupd and jdupes with cold file cache, or at least maybe I did. I ran the purge(8) command prior to each run. It claims to: “Purge can be used to approximate initial boot conditions with a cold disk buffer cache for performance analysis”. However, it made no difference at all in measured times for dupd nor jdupes.
Conclusions
It seems that in terms of performance, you’ll do better with dupd if you’re on SSDs but if you’re on HDDs then jdupes can be faster. Ideally, try both and let us know!
Also, even though tuning and testing the performance is so much fun, ultimately usability matters even more. For me, the interactive workflow supported by dupd is what makes it special (but then, that’s why I wrote it so I’m biased ;-) and I couldn’t live without it.
Finally, thanks to Jody for fixing a bug in dupd that showed up only on XFS (which I don’t use so never noticed) and for prompting me to do a few additional enhancements.
Raw Data (commands and times)
SSD: dupd, normal usage
% repeat 7 time dupd scan -p $HOME -q --hidden
dupd scan -p $HOME -q --hidden  4.89s user 8.00s system 138% cpu 9.273 total
dupd scan -p $HOME -q --hidden  5.04s user 8.23s system 142% cpu 9.335 total
dupd scan -p $HOME -q --hidden  4.98s user 7.78s system 139% cpu 9.141 total
dupd scan -p $HOME -q --hidden  4.86s user 7.92s system 139% cpu 9.146 total
dupd scan -p $HOME -q --hidden  5.61s user 8.00s system 143% cpu 9.503 total
dupd scan -p $HOME -q --hidden  4.95s user 7.79s system 140% cpu 9.082 total
dupd scan -p $HOME -q --hidden  4.96s user 7.80s system 139% cpu 9.119 total

average = 9.20
SSD: dupd, clear file cache
% repeat 7 (sudo sh -c "echo 3 > /proc/sys/vm/drop_caches"; time dupd scan -p $HOME -q --hidden)
dupd scan -p $HOME -q --hidden  11.86s user 43.55s system 54% cpu 1:42.54 total
dupd scan -p $HOME -q --hidden  12.42s user 44.47s system 55% cpu 1:43.41 total
dupd scan -p $HOME -q --hidden  12.12s user 43.65s system 56% cpu 1:39.03 total
dupd scan -p $HOME -q --hidden  12.22s user 43.37s system 55% cpu 1:40.69 total
dupd scan -p $HOME -q --hidden  12.60s user 45.28s system 53% cpu 1:47.55 total
dupd scan -p $HOME -q --hidden  12.10s user 44.51s system 54% cpu 1:44.18 total
dupd scan -p $HOME -q --hidden  12.43s user 43.74s system 57% cpu 1:36.92 total

average = 101.97
SSD: dupd, do not create database
% repeat 7 time dupd scan -p $HOME -q --hidden  --nodb > results
dupd scan -p $HOME -q --hidden --nodb > results  4.26s user 7.70s system 136% cpu 8.785 total
dupd scan -p $HOME -q --hidden --nodb > results  4.36s user 7.54s system 136% cpu 8.710 total
dupd scan -p $HOME -q --hidden --nodb > results  4.28s user 7.69s system 136% cpu 8.770 total
dupd scan -p $HOME -q --hidden --nodb > results  4.23s user 7.64s system 136% cpu 8.708 total
dupd scan -p $HOME -q --hidden --nodb > results  4.34s user 7.58s system 136% cpu 8.757 total
dupd scan -p $HOME -q --hidden --nodb > results  4.19s user 7.66s system 135% cpu 8.736 total
dupd scan -p $HOME -q --hidden --nodb > results  4.58s user 7.75s system 140% cpu 8.772 total

average = 8.75
SSD: dupd, clear file cache and do not create database
repeat 7 (sudo sh -c "echo 3 > /proc/sys/vm/drop_caches"; time dupd scan -p $HOME -q --hidden  --nodb > results)
dupd scan -p $HOME -q --hidden --nodb > results  9.67s user 36.51s system 51% cpu 1:29.39 total
dupd scan -p $HOME -q --hidden --nodb > results  10.92s user 43.76s system 53% cpu 1:41.45 total
dupd scan -p $HOME -q --hidden --nodb > results  10.79s user 43.58s system 54% cpu 1:38.93 total
dupd scan -p $HOME -q --hidden --nodb > results  10.62s user 43.59s system 56% cpu 1:35.45 total
dupd scan -p $HOME -q --hidden --nodb > results  10.76s user 44.39s system 54% cpu 1:41.45 total
dupd scan -p $HOME -q --hidden --nodb > results  10.92s user 43.78s system 55% cpu 1:38.87 total
dupd scan -p $HOME -q --hidden --nodb > results  10.72s user 43.07s system 53% cpu 1:41.50 total

average = 99.23
SSD: jdupes, warm file cache
repeat 7 time jdupes -q -r $HOME > results
jdupes -q -r $HOME > results  10.54s user 14.91s system 99% cpu 25.626 total
jdupes -q -r $HOME > results  10.76s user 14.66s system 99% cpu 25.587 total
jdupes -q -r $HOME > results  10.68s user 14.86s system 99% cpu 25.725 total
jdupes -q -r $HOME > results  10.76s user 14.67s system 99% cpu 25.614 total
jdupes -q -r $HOME > results  10.62s user 14.76s system 99% cpu 25.549 total
jdupes -q -r $HOME > results  10.75s user 14.87s system 99% cpu 25.801 total
jdupes -q -r $HOME > results  10.48s user 14.87s system 99% cpu 25.527 total

average = 25.62
SSD: jdupes, clear file cache
repeat 7 (sudo sh -c "echo 3 > /proc/sys/vm/drop_caches"; time jdupes -q -r $HOME  > results)
jdupes -q -r $HOME > results  26.11s user 72.99s system 67% cpu 2:25.89 total
jdupes -q -r $HOME > results  26.54s user 71.06s system 68% cpu 2:22.01 total
jdupes -q -r $HOME > results  24.64s user 72.62s system 66% cpu 2:26.57 total
jdupes -q -r $HOME > results  26.01s user 70.05s system 68% cpu 2:20.15 total
jdupes -q -r $HOME > results  26.25s user 72.48s system 67% cpu 2:26.67 total
jdupes -q -r $HOME > results  24.63s user 70.70s system 67% cpu 2:20.77 total
jdupes -q -r $HOME > results  25.41s user 72.40s system 68% cpu 2:23.80 total

average = 143.81
Slow Disk: dupd, normal usage
% repeat 5 time dupd scan -p $HOME --hidden -q
dupd scan -p $HOME --hidden -q  4.62s user 29.72s system 2% cpu 21:05.70 total
dupd scan -p $HOME --hidden -q  4.38s user 29.88s system 2% cpu 22:34.14 total
dupd scan -p $HOME --hidden -q  4.78s user 30.09s system 2% cpu 21:29.52 total
dupd scan -p $HOME --hidden -q  4.37s user 29.07s system 2% cpu 21:18.10 total
dupd scan -p $HOME --hidden -q  4.39s user 29.24s system 2% cpu 21:11.19 total

average = 1279.60
Slow Disk: jdupes, warm file cache
% repeat 5 time jdupes -q -r $HOME > results
jdupes -q -r $HOME > results  8.88s user 31.70s system 5% cpu 13:05.37 total
jdupes -q -r $HOME > results  8.87s user 30.51s system 5% cpu 12:41.61 total
jdupes -q -r $HOME > results  8.80s user 30.56s system 4% cpu 13:30.56 total
jdupes -q -r $HOME > results  8.85s user 30.62s system 5% cpu 12:34.43 total
jdupes -q -r $HOME > results  8.80s user 30.18s system 5% cpu 12:32.14 total

average = 767.14