Some dupd performance improvements

Performance Improvements in dupd 1.2

Recently I’ve done a few performance improvements to dupd, motivated by one particular edge case file set I was working with a while back. That file set had very large numbers (over 100K) of files of the same size (these were log files from a production system where the content was always different but due to the structure of the files they tended to have the same size). This was a worst case scenario for dupd given the way it grouped files of the same size as potential duplicates. With the latest changes (in dupd 1.2) this scenario is dramatically faster (scan time reduced from about an hour to about five minutes – see below).

In more common scenarios these improvements don’t make a big difference but there is still some small benefit. Memory consumption is also reduced in dupd 1.2 (there is more room to reduce memory consumption that I might play with if I have time some day).

In a nutshell, dupd 1.2 should be either no slower, slightly faster or in some edge cases dramatically faster than dupd 1.1.

The edge case: lots of files of the same size

dupd_samesizes
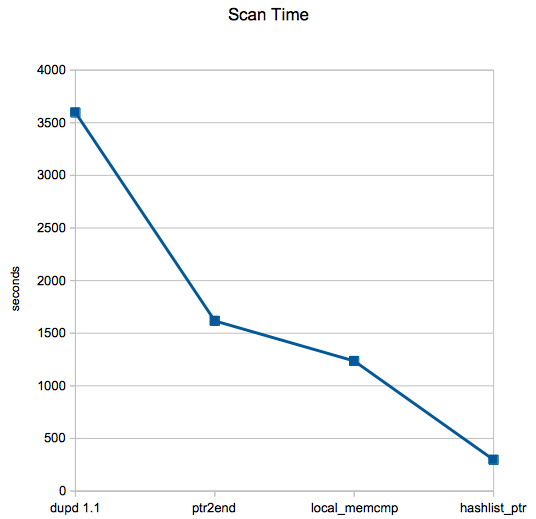
With dupd 1.1 scan time was 59m57s which is what motivated me to improve it for that file set. Now with dupd 1.2, scan time for the same file set is only 4m57s! Mission accomplished.

The three main changes were:

  • ptr2end (Reduced time from 59m57s to 26m57s) – Simply store a pointer to the end of the size list instead of walking it. Normally the size lists are tiny, on average I see well under 10 elements. But when it grew to over 100K elements this made a huge difference.
  • local_memcmp (Reduced time from 26m57s to 20m36s) – Instead of using memcmp(3) always, use a local implementation when the buffers being compared are small. This made a surprising amount of difference.
  • hashlist_ptr (Reduced time from 20m36s to 4m57s) – As dupd processes file sets from the sizelist to the hashlists, it was copying the paths. Now, just copy pointers. This skips a lot of unnecessary strcpy(3)ing as well as reduces memory consumption.

Normal case: smaller set of files with no odd size distributions

That said, do these changes translate to any benefit on more “normal” file sets? Nowhere near as dramatically, but it’s still faster and uses less memory so that’s all good.

dupd_home
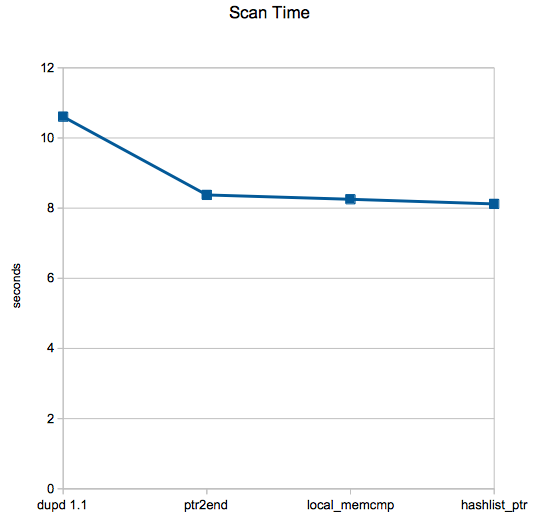
These scans are from my $HOME dir on one machine, scan time reduced from 10.6s (average of 5 runs) to 8.1s, an improvement of about 23%, not bad at all.

No change: spinning rust

All the numbers above are from machines with SSDs. I also tested on a couple machines with traditional hard drives and there was zero change in performance. No graph, it’s just a straight line ;-)

With normal hard drives, the file I/O time so completely dominates run time that there is no difference from any dupd improvements.

(I suspect the edge case file set would have seen improvement even on spinning rust, but I didn’t have the chance to test that scenario.)


heliod relocated

It’s unfortunate to downgrade from mercurial to git but overall should be for the better.

I have moved the heliod source code from its previous home to github here: https://github.com/jvirkki/heliod

I also copied the release-0.2 binaries (built on debian-6, Solaris 10×86 and Solaris 10 SPARC) to the github release files: https://github.com/jvirkki/heliod/releases

If for some reason you want to download the release-0.1 binaries, they are still available on sourceforge here: http://sourceforge.net/projects/heliod/files/


Duplicate file detection performance

Just over two years ago I tested my dupd against a couple other duplicate detection tools.

Recently I’ve been doing some duplicate cleanup again and while at it I added a few features to dupd and called it version 1.1. So this is as good time as any to revisit the previous numbers.

I tested a small subset of my file server data using six duplicate detection tools:

Results

The graph shows the time (in seconds) it took each utility to scan and identify all duplicates in my sample set. I’m happy to see dupd took less than half the time of the next fastest option (rdfind) and just over seven times faster than fdupes.

duplicates

Details

The Data

The sample set is 18GB in size and has 392,378 files. There are a total of 117,261 duplicates.

The Machine

I ran this on my small home server, which has an Intel Atom CPU S1260 @ 2.00GHz (4 cores), 8GB RAM, Intel 520 series SSD.

The Runs

For each tool, first I ran it once and ignored the time, just to populate file caches. Then I ran it five times in a row. Discarding the fastest and slowest time, I averaged the remaining three runs to come up with the time shown in the graph above. For most of the tools, the scan times were very consistent from run to run.

dupd

dupd scan --path $HOME/data -q  13.31s user 15.94s system 99% cpu 29.533 total

dupd scan --path $HOME/data -q  13.17s user 16.09s system 99% cpu 29.539 total
dupd scan --path $HOME/data -q  13.17s user 16.13s system 99% cpu 29.572 total
dupd scan --path $HOME/data -q  13.28s user 16.04s system 99% cpu 29.604 total

dupd scan --path $HOME/data -q  13.59s user 15.74s system 99% cpu 29.605 total

rdfind

rdfind -dryrun true $HOME/data  49.28s user 24.98s system 99% cpu 1:14.75 total

rdfind -dryrun true $HOME/data  49.08s user 25.29s system 99% cpu 1:14.87 total
rdfind -dryrun true $HOME/data  48.93s user 25.52s system 99% cpu 1:14.92 total
rdfind -dryrun true $HOME/data  48.92s user 25.53s system 99% cpu 1:14.95 total

rdfind -dryrun true $HOME/data  49.52s user 25.09s system 99% cpu 1:15.11 total

rmlint

./rmlint -T duplicates $HOME/data  63.53s user 52.55s system 113% cpu 1:42.69 total

./rmlint -T duplicates $HOME/data  64.67s user 52.46s system 113% cpu 1:43.43 total
./rmlint -T duplicates $HOME/data  64.01s user 53.14s system 113% cpu 1:43.63 total
./rmlint -T duplicates $HOME/data  66.47s user 54.32s system 113% cpu 1:46.13 total

./rmlint -T duplicates $HOME/data  67.20s user 56.00s system 113% cpu 1:48.55 total

fslint

./findup $HOME/data  129.46s user 40.77s system 111% cpu 2:32.05 total

./findup $HOME/data  129.75s user 40.53s system 111% cpu 2:32.10 total
./findup $HOME/data  129.58s user 40.82s system 111% cpu 2:32.28 total
./findup $HOME/data  129.89s user 40.80s system 112% cpu 2:32.30 total

./findup $HOME/data  130.47s user 40.34s system 112% cpu 2:32.36 total

fdupes

fdupes -q -r $HOME/data  43.16s user 170.29s system 96% cpu 3:41.87 total

fdupes -q -r $HOME/data  43.39s user 170.24s system 96% cpu 3:42.07 total
fdupes -q -r $HOME/data  42.88s user 170.87s system 96% cpu 3:42.13 total
fdupes -q -r $HOME/data  42.73s user 171.24s system 96% cpu 3:42.23 total

fdupes -q -r $HOME/data  43.64s user 170.83s system 96% cpu 3:42.86 total

fastdup

I was unable to get any times from fastdup as it errors out with “Too many open files”.

No Heartbleed for Heliod

The Internet is ablaze with talk about the OpenSSL vulnerability nicknamed Heartbleed (CVE-2014-0160). It is, arguably, one of the worst SSL vulnerabilities in recent memory given how trivial it is to exploit. Attackers can, without leaving any trace and with zero effort, read up to 64K of data from the server (or client) address space. What’s there will vary, but may, if you get (un)lucky include private keys, passwords or other sensitive info.

Of course, it is not an SSL protocol vulnerability. It is a bug in the OpenSSL implementation. Those of you (us) running the heliod web server have had nothing to do this week since heliod fortunately does not use OpenSSL (it uses NSS). It is a relief, after running around at work to address the Heartbleed vulnerability, that I don’t have to do anything to fix  my personal web servers which wisely run heliod!

If you’d also like to run the best performing and most secure web server around, check out heliod.

The Curse of Maven

This is my most delayed blog entry ever… I wrote the first draft many years ago and for some reason it just sat there. Recently a friend got stuck having to deal with maven and I remembered this article, so might as well post it.

Lately we’re seeing lots of tools which completely miss the point of The UNIX Philosophy. Perfection is achieved through a collection of small simple tools, all of which do one thing very well and allow themselves to be combined with ease.

A counterexample which gets everything wrong is maven. It’d be easy to dismiss tools which are as bad as that. Unfortunately the attraction of these tools is that they make it very easy to get started and thus they become hugely popular (another example of this thinking is Rails; yet another example is Hibernate).

The siren call of these tools is they let you get started without effort nor understanding, which is not a bad thing in itself. But as soon as your project grows beyond the hello world stage, you’ll be stuck wasting most of your time fighting the constraints of the tool. It is never a bargain worth making.

Here’s the example that motivated this article some years ago. This is an actual piece from a maven build file I had to work on once:

      <plugin>
        <groupId>org.codehaus.mojo</groupId>
        <artifactId>exec-maven-plugin</artifactId>
        <version>1.1.1</version>
        <executions>
          <execution>
            <id>some-execution</id>
            <phase>package</phase>
            <goals>
              <goal>exec</goal>
            </goals>
          </execution>
        </executions>
        <configuration>
          <executable>tar</executable>
          <workingDirectory>${project.build.directory}</workingDirectory>
          <arguments>
            <argument>-zxvf</argument>
            <argument>${project.name}-${project.version}-distribution.tar.gz</argument>
          </arguments>
        </configuration>
      </plugin

Here is the equivalent line (yes, one line!) from a Makefile:

        cd ${project.build.directory} && tar -zxf ${project.name}-${project.version}-distribution.tar.gz

The specific action here is not the point (I bet there is a maven plugin these days to make builing a tarball a bit easier, though not as easy as with the Makefile; keep in mind this example is from years ago). The fundamental insight here is that a tool like maven which requires every action to be built will by definition never be able to be as flexible and effective as a tool which can directly leverage all the existing tooling available on UNIX.

More recently I’ve been having to deal with gradle instead. While it is a slight improvement over maven, it is also a result of this misguided culture of trying to hide complexity which results in making easy things easy, moderate things excruciatingly difficult and difficult things completely impossible.

Here’s another article on the topic: Why Everyone (Eventually) Hates (or Leaves) Maven


Satisfying debian JDK package dependencies

I prefer to run the Sun JDK on my debian servers but this presents a bit of a logistical inconvenience. Because debian now packages OpenJDK instead, all the other Java packages depend on it. What I’d really prefer to do is manually install the (non-packaged) Sun JDK and tell dpkg that the JDK dependency is satisfied so I can still install any java tools directly via apt.

(There is a java-package in debian which is meant to address this by converting the JDK download into an installable package, but unfortunately it appears to always be sufficiently behind in its JDK version support that it has never worked for me.)

Luckily there is an easy way out. I didn’t find an explicit how-to on doing it so writing down these notes for my (and perhaps your) future benefit.

Install the equivs package:

# apt-get install equivs

Create a template for a ‘jdk’ package:

# equivs-control jdk

Edit that template so it provides the necessary content. Adjust this to specific needs on a given system but this is what I’m using currently (if you use this as-is there’s no need to create the template above, but it is useful to see what fields it provides, perhaps they change over time):

Section: misc
Priority: optional
Standards-Version: 3.9.2
Package: manual-jdk
Version: 1.7
Depends: java-common
Maintainer: <root@localhost>
Provides: java6-runtime-headless, java-compiler, java-virtual-machine, java2-runtime, java2-compiler, java1-runtime, default-jre-headless, openjdk-7-jre-headless, openjdk-7-jre-lib
Description: Manually installed JDK
 JDK was installed manually. This package fulfills dependencies.

Then, build the placeholder package:

# equivs-build jdk

This will produce a .deb package named after the info in the above template, ready to be installed.


TLS and RC4 (March 2013)

You have probably read (e.g. at slashdot and everywhere else) about this month’s SSL/TLS weakness, this time around related to RC4.

The authors have a good page at http://www.isg.rhul.ac.uk/tls/ which is a good starting point. The slide deck at http://cr.yp.to/talks/2013.03.12/slides.pdf has nice raw data and graphs.

The attack

RC4 is a stream cipher (not a block cipher like DES or AES). In short, RC4 is essentially a pseudo-random number generator. To encrypt, the resulting stream of bits are combined (XOR’d) with the plaintext to generate the ciphertext. Ideally, if the random bits were truly random there would not be any patterns or biases in the output. For every byte, each possible value (0-255) should be equally likely.

This is not quite true for RC4. Also, that is not news, it had been shown earlier. But this latest work has mapped out in detail the biases in all first 256 bytes of the stream output (the slide deck has graphs for all of those). Given that info, it becomes statistically possible to recover plaintext from the first 256 bytes. The probability of success depends on how much ciphertext has been captured. See slides 305 to 313 of the slide deck for success probabilities. To summarize, with 224 ciphertexts we can already recover some bytes. With 232 ciphertexts we can recover just about all of the plaintext with near certainty.

This attack is on RC4 output, not specific to TLS protocol. TLS is the victim since RC4 is used in several of the most commonly used TLS ciphersuites. Recall that as a mitigation to some of the other recent TLS attacks there have been recommendation to switch to RC4 as a way to avoid the CBC ciphersuites! Now the pendulum swings the other way.

In practice

As with most attacks, the theoretical result is not necessarily so easily applied in practice.

This attack has a few things going for it though. It is not a timing attack, so it does not need to rely on carefully measuring execution time biases over a noisy network. Also, the attacker only needs to passively observe (and record) the encrypted exchanges between the two parties. The attacker does not need to be able to intercept or modify the communication.

The attacker still does need to capture a fair amount of ciphertext. On the surface, the numbers are not very big. 224 is less than 17 million requests (although that only gets you some bytes of the plaintext). For certainty, 232 is over 4 billion requests. Harder, but not an intractable problem. And as the saying goes, attacks only ever get better. It is conceivable some future work will identify even more efficient ways of correlating the content.

For the attack to work, each of those requests does need to have the same plaintext content in the same location (or, at least, for those bytes we care to recover). Assuming HTTP plaintext, the protocol format will tend to produce mostly constant content which works to the benefit of the attacker.

For example, take the following request (edited, but a real capture from my gmail connection). The cookie value starts at about byte 60 and if the browser generated it in that location once, every repeat of the same request is likely to have the same content in the same place.

GET /mail/?tab=om HTTP/1.1
Host: mail.google.com
Cookie: GX=ahc8aihe3aemahleo5zod8vooxeehahjaedufaeyohk4saif8cachoeph...
...

So now the attacker just needs to trick the victim’s browser into repeating those requests and sit back and record the traffic. Tricking the browser into making the requests is not that hard, plenty of attack channels available on that front. Successfully making enough of them before someone/something notices (e.g. gmail monitoring… although your local credit union probably won’t notice as fast) or the content changes (e.g. cookie expires) will be trickier but not impossible.

So it seems to me this attack is relatively hard to pull off in practice right now, but not impossible. Repeat the attack enough time on enough people and a few will succeed.

Some prevention

  • Change cookie/token values (whatever content is valuable to attack) often enough that capturing enough ciphertext within that time window becomes that much harder or even impossible.
  • Making header order/length unpredictable would help (same bytes won’t be in the same locations) but needs to be done by browsers (for the most likely attack scenario).
  • Avoid RC4 ciphersuites.
  • AES-GCM ciphersuites have been mentioned as an alternative to avoid both RC4 and CBC modes, but support for those is not quite there yet and there is a performance penalty.

Additional reading…


Using node.js for serving static files

A couple months ago I ran some tests on web server static file performance comparing a handful of web servers. I’ve been curious to add node.js into the mix just to see how it behaves. Last night I ran the same test suite against it, here are the results.

There are a handful of caveats:

  1. Serving files isn’t a primary use case for node.js. But I’ve seen it being done so it’s not unheard-of either.
  2. By itself node.js doesn’t handle serving static files so to test it I had to pick some code to do so. There isn’t any one standard way so I had to pick one. After extensive research (about 15 minutes of googling) I went with ‘send‘. I’m using the sample from the readme as-is. There is some risk that I picked the worst choice and a different node.js solution for static files might be much better! If so, please let me know which one so I can try it.

I used node 0.8.18 (latest as of today) and send 0.1.0 as installed by npm.

For details on the benchmark environment see my earlier article and previous results. I ran exactly the same test on the same hardware and network against node.js as I did earlier with the other web servers.

All right, so how did it do? Very, very slowly, I have to say.

Average throughput (over the 30 minute test run) was only 490 req/s with a single client (sequential requests) which is slower than anything else I’ve seen before. Node.js inches up to 752 req/s with ten concurrent clients (remember these are zero think-time clients). Here is the throughput graph including all the previously tested server with the addition of node.js:

How about response times? The graph below shows the 90th percentile response time from the run. With only one or two concurrent clients, node.js has slightly better response time than g-wan but still slower than everything else. As concurrent clients increase, node.js becomes slower than any other choice. This is not surprising given its single-threaded cooperative multitasking design.

No surprises in the CPU utilization graph. Given that node.js is single-threaded, it can only take advantage of one hardware thread in one core so it maxes out at roughly 75% idle.

Network utilization is particularly bad, peaking at a max of about 5.5% of the gigabit interface. Every other web server can pump out a lot more data into the pipe.

Given the above results, needless to say node.js will not score well in my ‘web server efficiency index’ (see my post on web server efficiency). For static files, node.js is the least efficient (least bang for the CPU buck) solution. Here’s the graph:

In summary… if you’re thinking about serving static files via node.js, consider an alternative. Any alternative will be better! In particular, if you want to maximize both performance and efficiency, try out heliod. If you prefer going with something you may be more familiar with, nginx will serve you well. Or as a front-end cache, varnish is also a solid choice (although not as efficient).